Diagrams
Diagrams are a powerful tool for visualizing complex systems and processes. They can help understand important information quickly and clearly.
However, creating diagrams can be time-consuming and tedious. You have to spend hours in the diagramming app such as Lucidchart or diagrams.net.
This is where diagrams as code come in.
Diagrams as code
As the name suggests, diagrams as code involve writing code to generate diagram images or HTML automatically. The most popular and mature tools for that are PlantUML and Mermaid.
Example
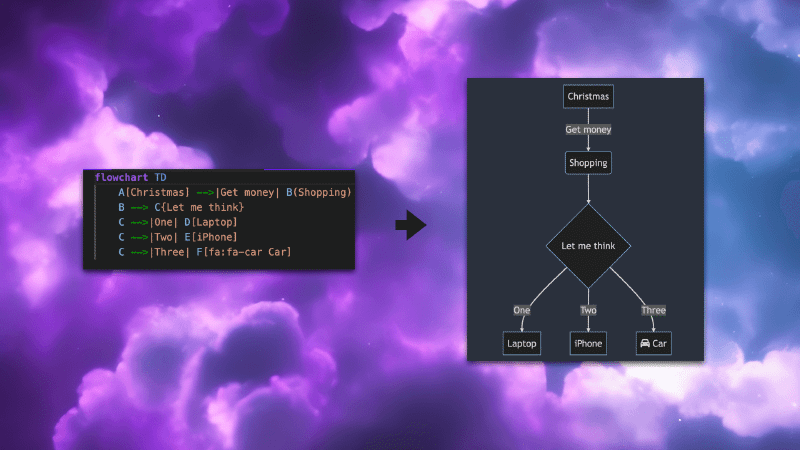
Let’s create a simple visualization with the Mermaid.js tool.
Here is our code:
|
|
And this is our visualization.
Benefits
Diagrams as code have several benefits over traditional diagramming apps, including:
Time-saving
A most important benefit of diagrams as code is that they can save time when editing existing diagrams.
Since diagrams are defined as code, changes can be made quickly and easily without manually adjusting the layout or formatting.
Example
Add new actor
All changes can be achieved with just a few lines of code.
Automation
The structure of a diagram code is simple and allows for the automation of the diagram creation process.
There is a variety of tools for generating diagrams from database structures, OpenAPI specifications, and code.
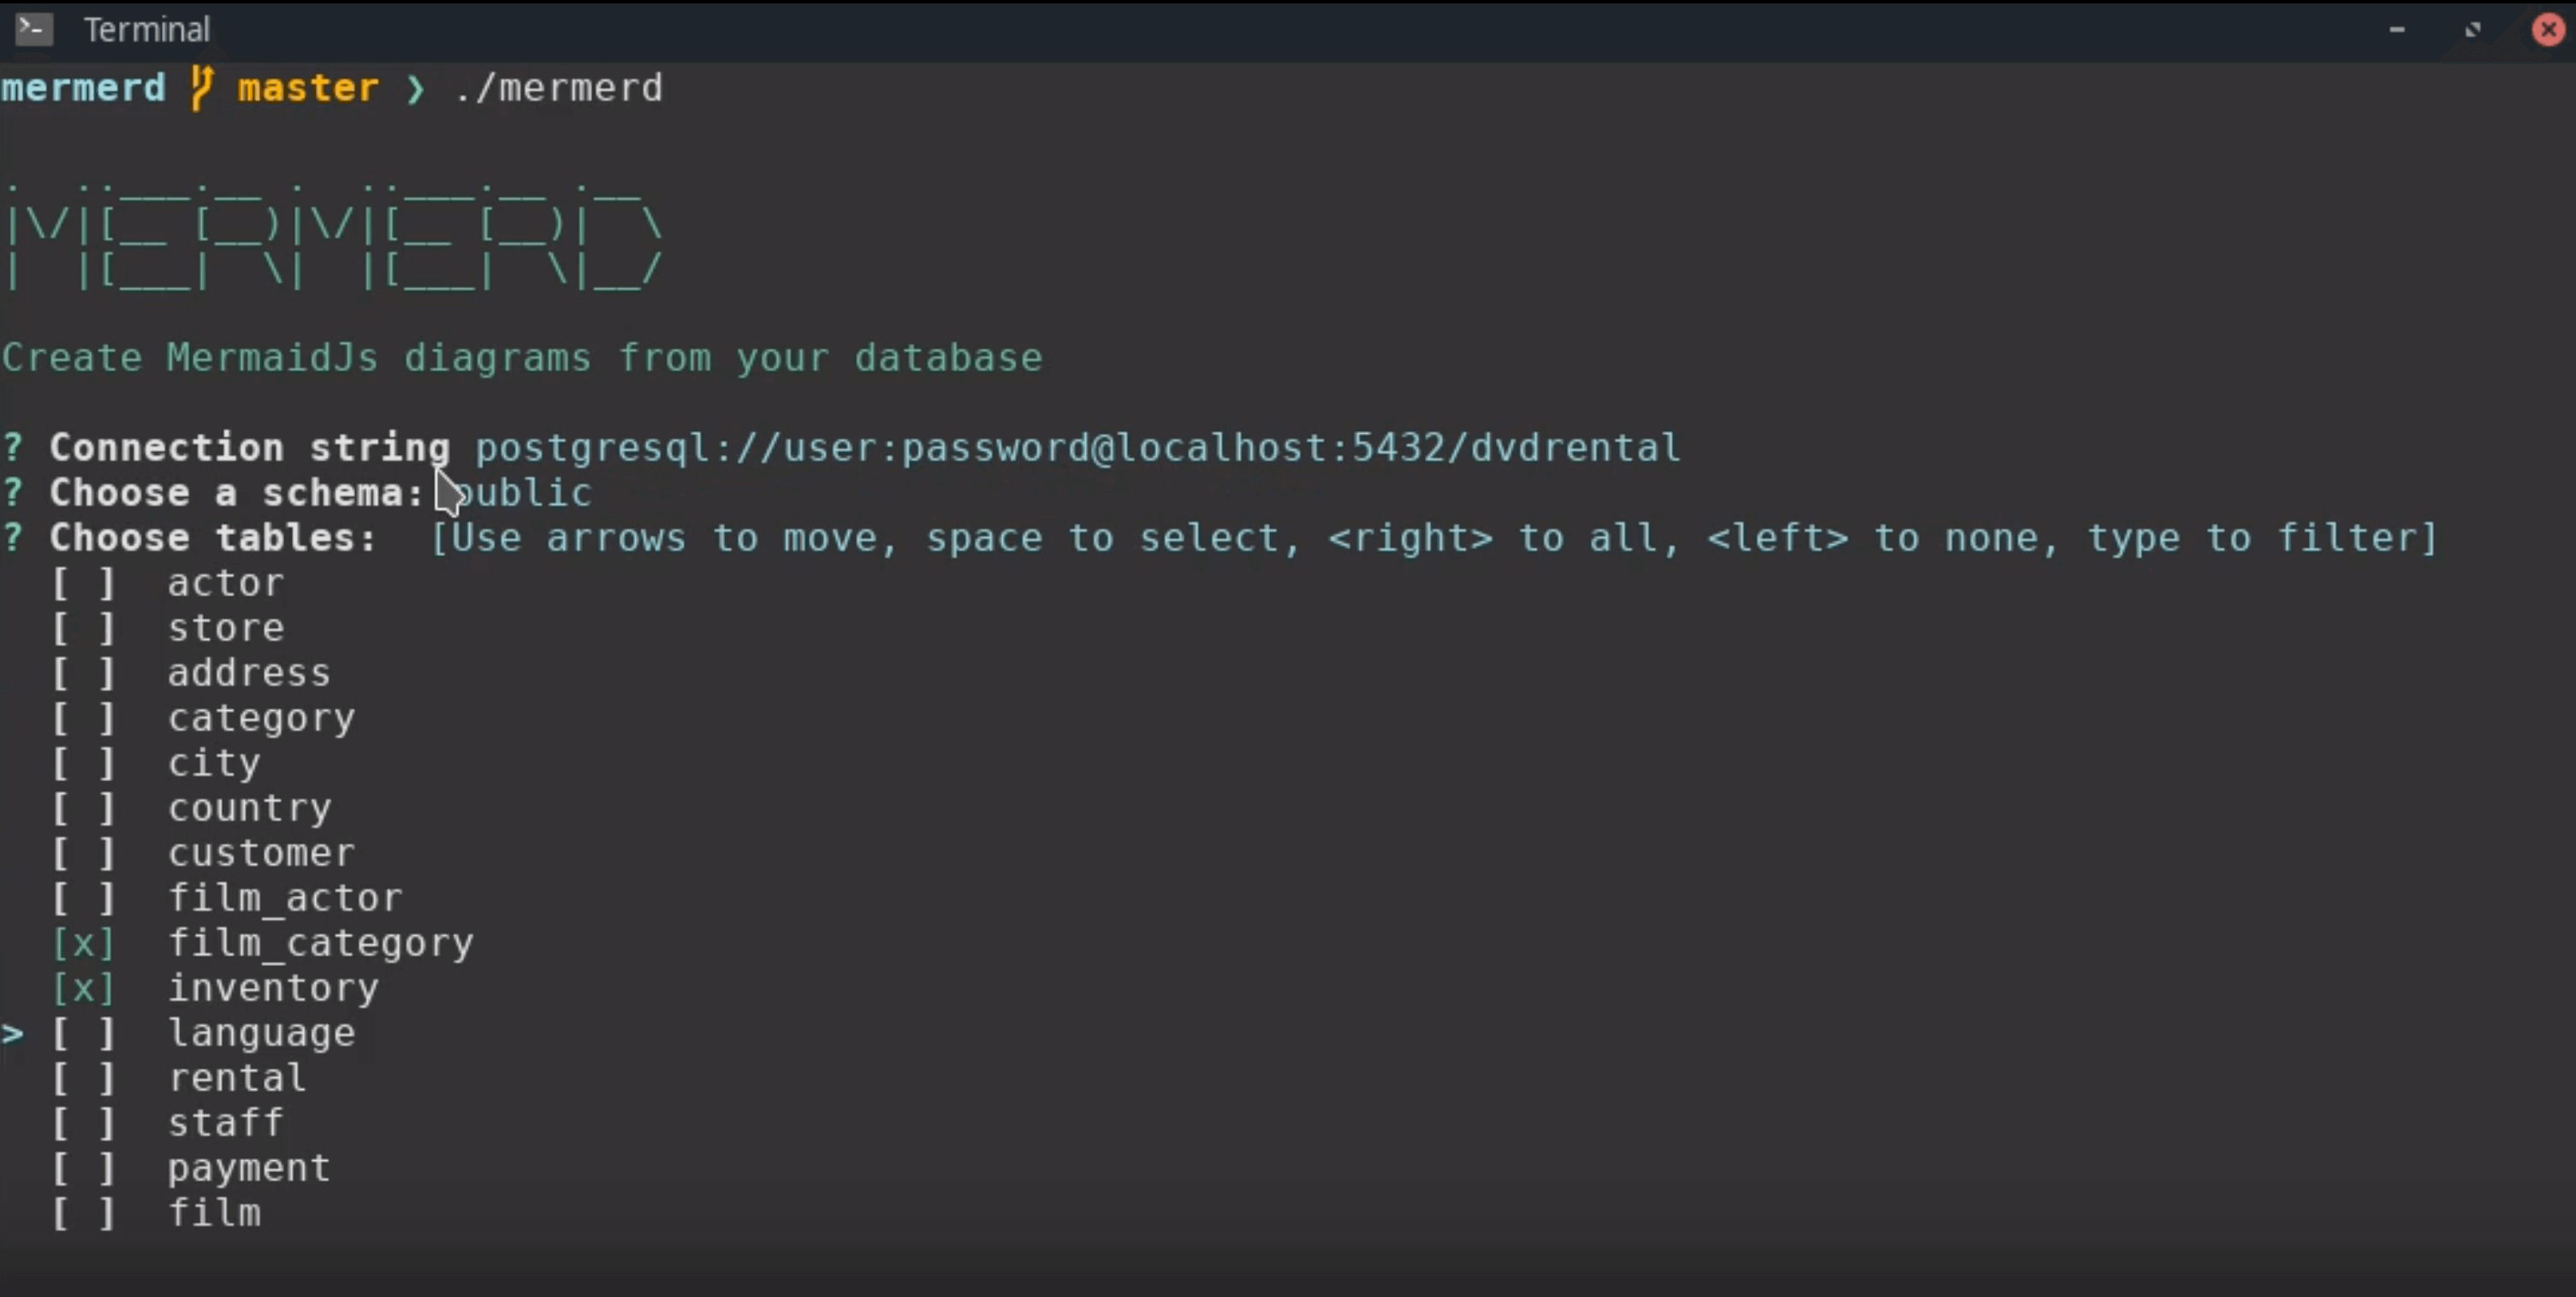
ER tool examples:
- mermerd - creates mermaid entity relation diagrams from database schema
- schemacrawler - tool for easy writing scripts on top of database schema data
System tool examples:
- inframap - get terraform visualization
Version control
You can get all the benefits of using Git, such as:
- Storing diagram data in GitHub-like services with all changes in history;
- Tracking, reviewing, and merging changes with conflict resolution.
Existing continuous integration tools can be used to analyze, check proper code style, enrich, and generate documentation pages.
Customization
Diagrams as code tools have many existing themes and settings that can be used for style customization.
Open source
Diagrams as code tools are open-source and free to use. You own your data.
Downsides
There are some things that may not be intuitive.
No UI
There is no component choosing menu or forms with all parameters. Therefore, you need to know what you are looking for and find it in the documentation and examples.
Frustrating layout correction
Rare problem. The automatically generated layout may not satisfy you in complex schemas. If that happens, you need to use LAYOUT commands to correct the generator.
Learning
Mermaid
A beautiful and popular tool for popular diagrams. JavaScript based.
- Easy docs
- Playground - you can share diagrams by link and save drafts in browser storage
PlantUML
PlantUML may be considered an old-school tool, but it is still irreplaceable for some diagrams, such as C4 architecture.
Kroki
Kroki is a multi-language tool. You can explore all diagram types.
Usage
- Find and install a Confluence plugin for Mermaid or PlantUML diagrams;
- Use a static site generator theme with mermaid included (Blog/Docs);
- There is a 99% chance of finding a plugin or out-of-the-box feature in your documentation tool.
Conclusion
With a little learning time, you can efficiently:
- Reuse existing diagrams to bootstrap new ones;
- Visualize new features on existing diagrams;
- Get diagrams automatically from code or system configuration.
As a professional software developer, I prefer to use PlantUML or Mermaid, even in the early design stages.
That allows me to quickly iterate the design by copying and making changes to the current draft.